Sales statistics
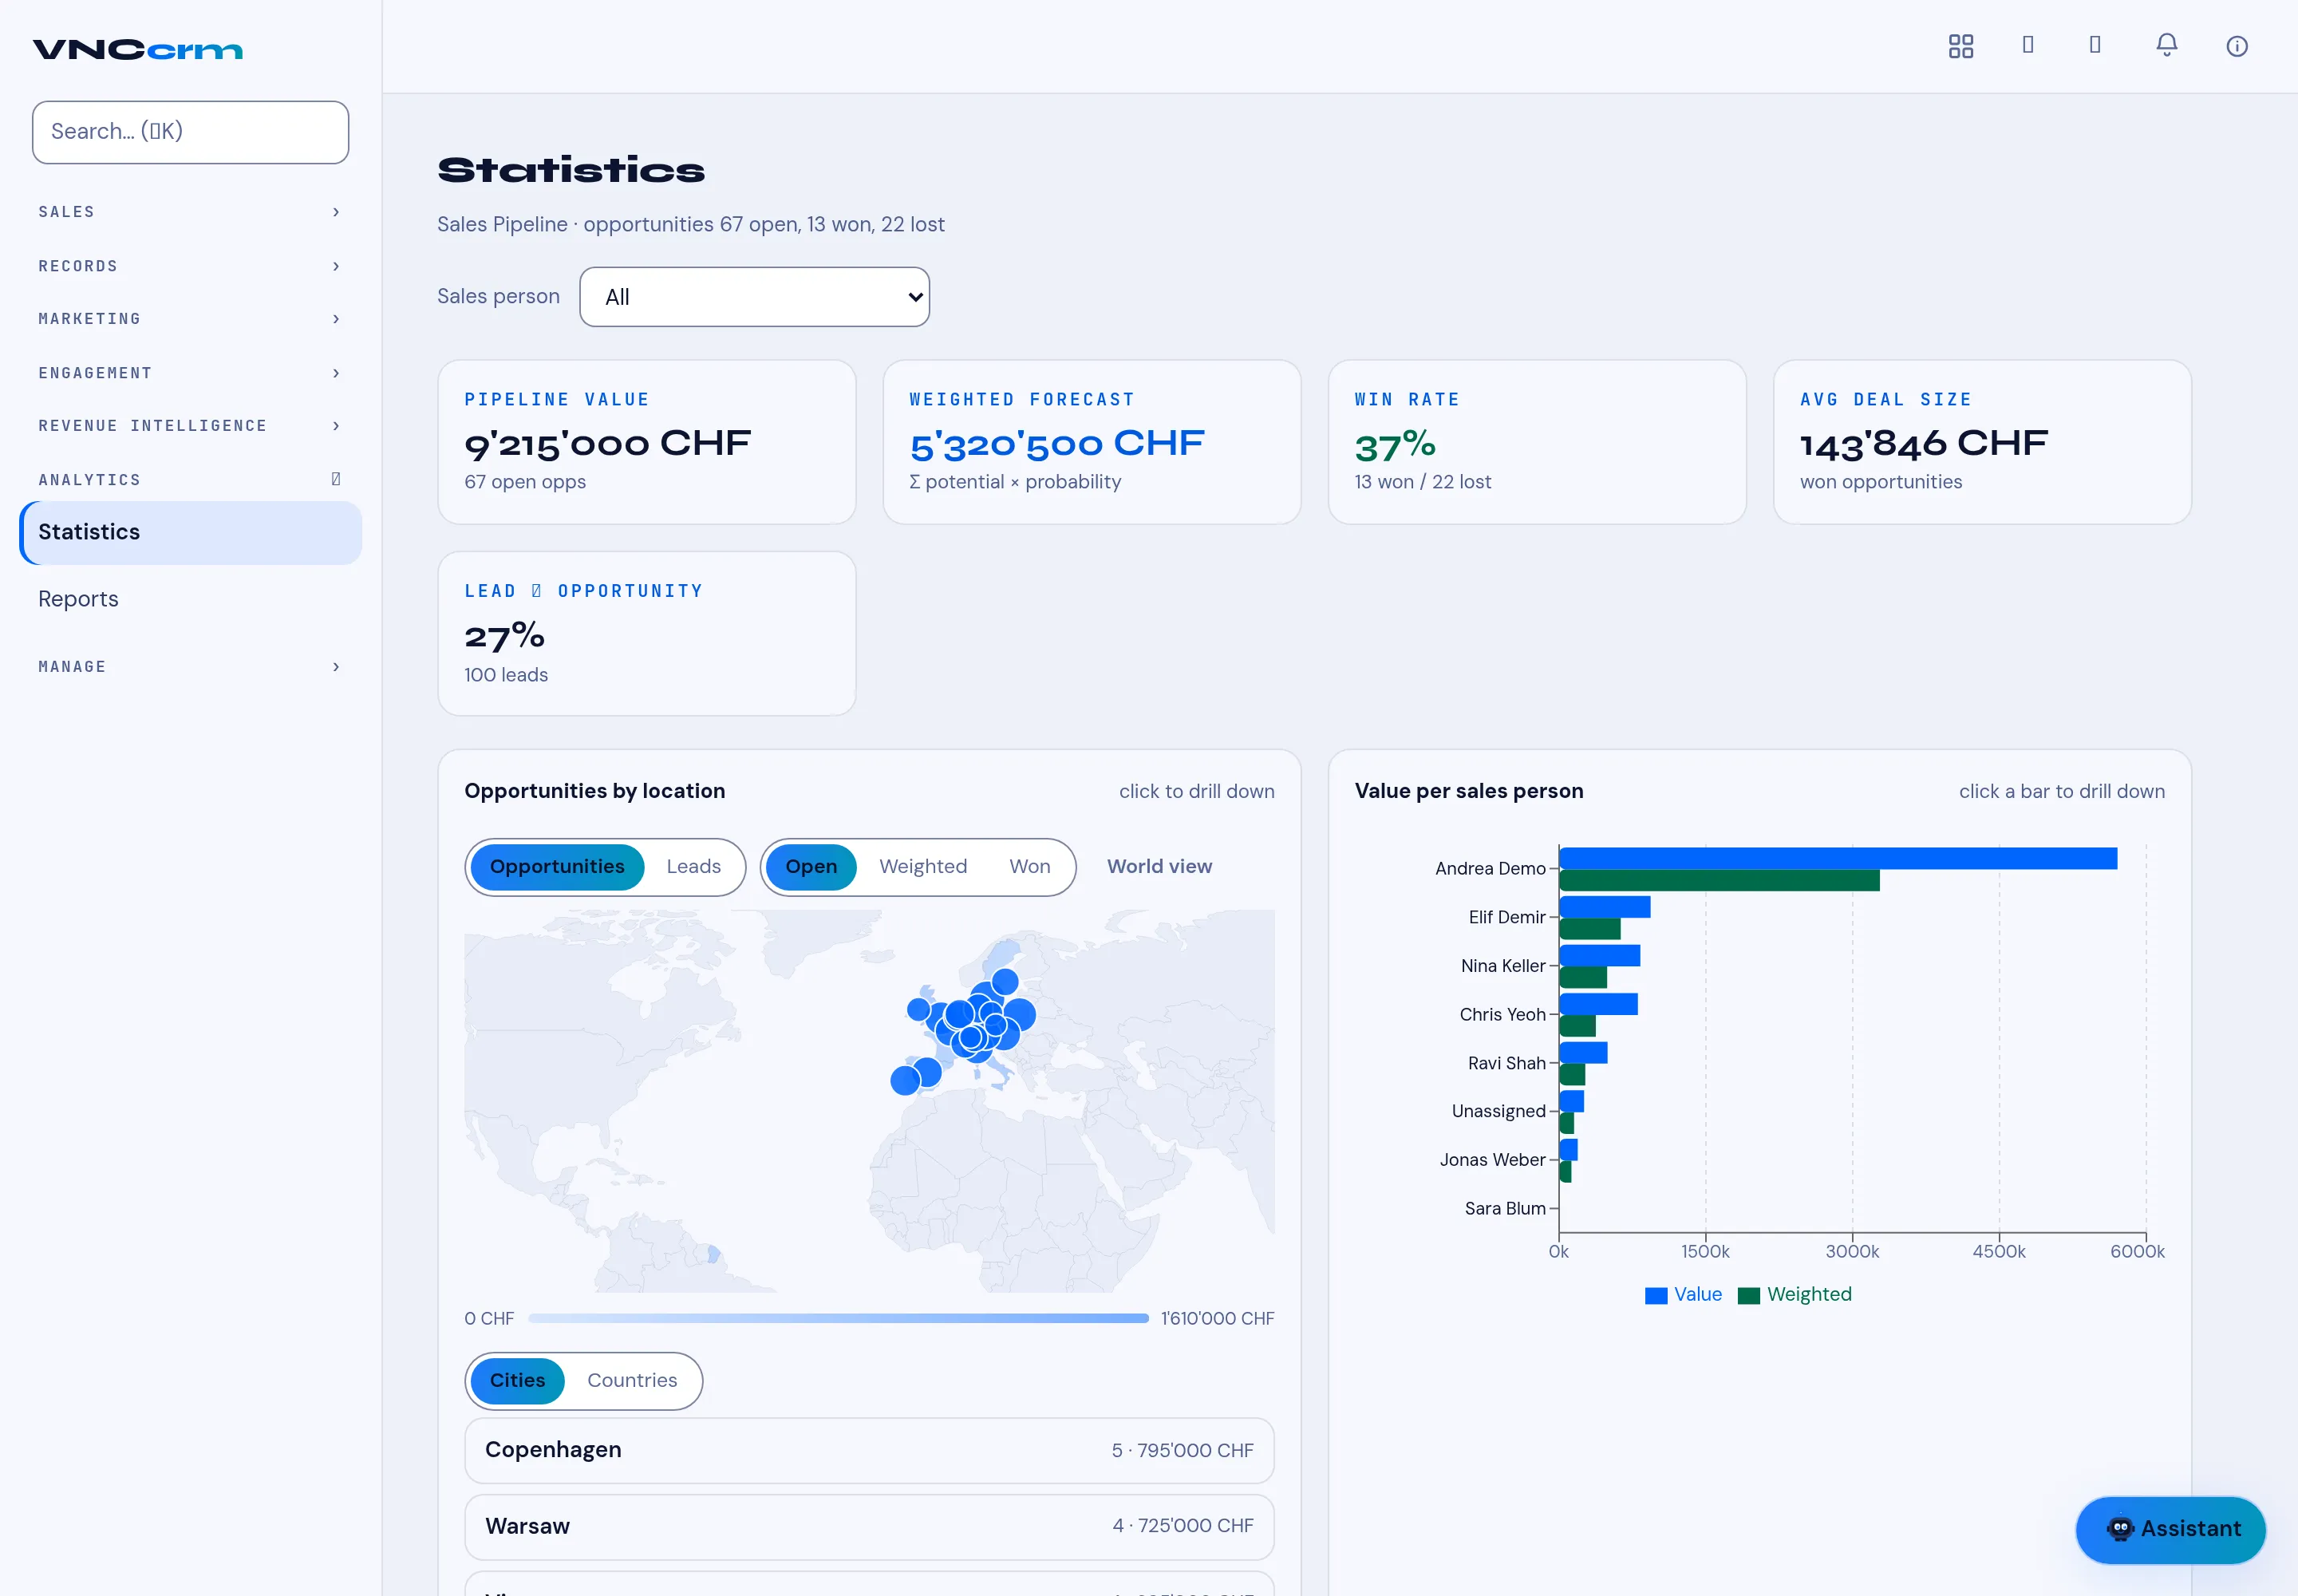
Statistics (under ANALYTICS) is the sales dashboard. The subtitle counts the pipeline — for example Sales Pipeline · opportunities 65 open, 13 won, 22 lost — and Sales person filters it.
The KPI band
Section titled “The KPI band”| Card | Meaning |
|---|---|
| Pipeline value | The value of the open opportunities. |
| Weighted forecast | Σ potential × probability. |
| Win rate | Won ÷ (won + lost). |
| Avg deal size | The mean value of won opportunities. |
| Lead → opportunity | How many leads became opportunities. |
Charts
Section titled “Charts”- Opportunities by location — a map with Opportunities / Leads and Open / Weighted / Won toggles and a World view; below it the Cities / Countries ranking with values.
- Value per sales person — a bar chart of Value and Weighted per person.
Click a chart element to drill down.